Digital Gaming is transforming at a tremendous pace. It is difficult for developers to come up with fixed formulae of success. Games are being developed for various digital spaces (online, mobile, consoles, tablets), opening multi-dimensional opportunities for developers.
Research firm Ovum predicts that the digital gaming market, which comprises of online games played on the PC, console, or Smartphone, will double over the next five years to $53 billion.
Statistics from Entertainment Software Association (Fig. 1) show the popularity of the gaming genres irrespective of the platform.

Fig.1
Popular Trends in Gaming
The gaming industry is popularly divided between two business models.
1) Free-to-Play
Free-to-play (F2P) are games available free of cost for download/play on social media or mobile. The model was introduced in the form of multiplayer online games and helped to fight piracy.
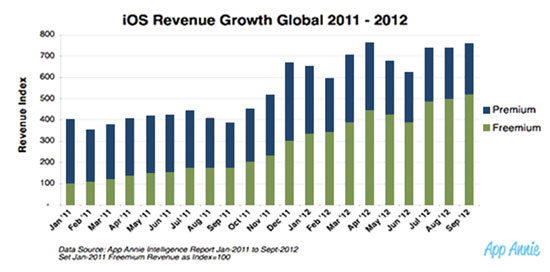
F2P further branched out to the Freemium model. Freemium model allows the player to avail and play the game for free but is charged for the more advance features, functionality, or virtual goods.
Statistics by App Annie (Fig. 2) show the global growth in revenue through freemium games.

Fig. 2
2) Mobile Gaming
The market for mobile gaming, alone, is expected to triple to $17.5 billion by 2016, says Ovum.
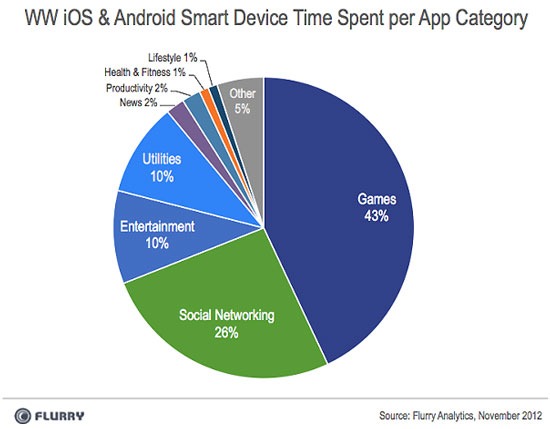
Gaming is the most popular category in mobile usage, with huge growth seen in Apple’s iOS and Google’s Android platforms. People spend more time on games than any other activity. Currently we are witnessing the emergence of social networking with social gaming. Gamification will change the face of social communication in near future. You can root your phone using Framaroot apk to improve gaming experience.
Statistics by Flurry (Fig. 3) highlight the time spent by users on various activities on smart phones.

Fig. 3
Revenue Forecast by Juniper Research
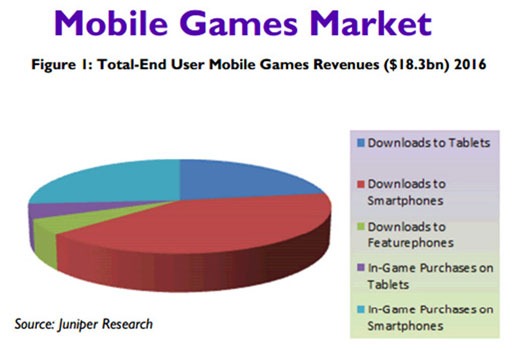
Smart phones have been the major contributors in the growth of mobile gaming and are expected to continue adding major chunk of revenue in mobile gaming space for quite some time.
Statistics (Fig. 4) show mobile game revenues generated by different categories.

Fig. 4

